
Good at one thing
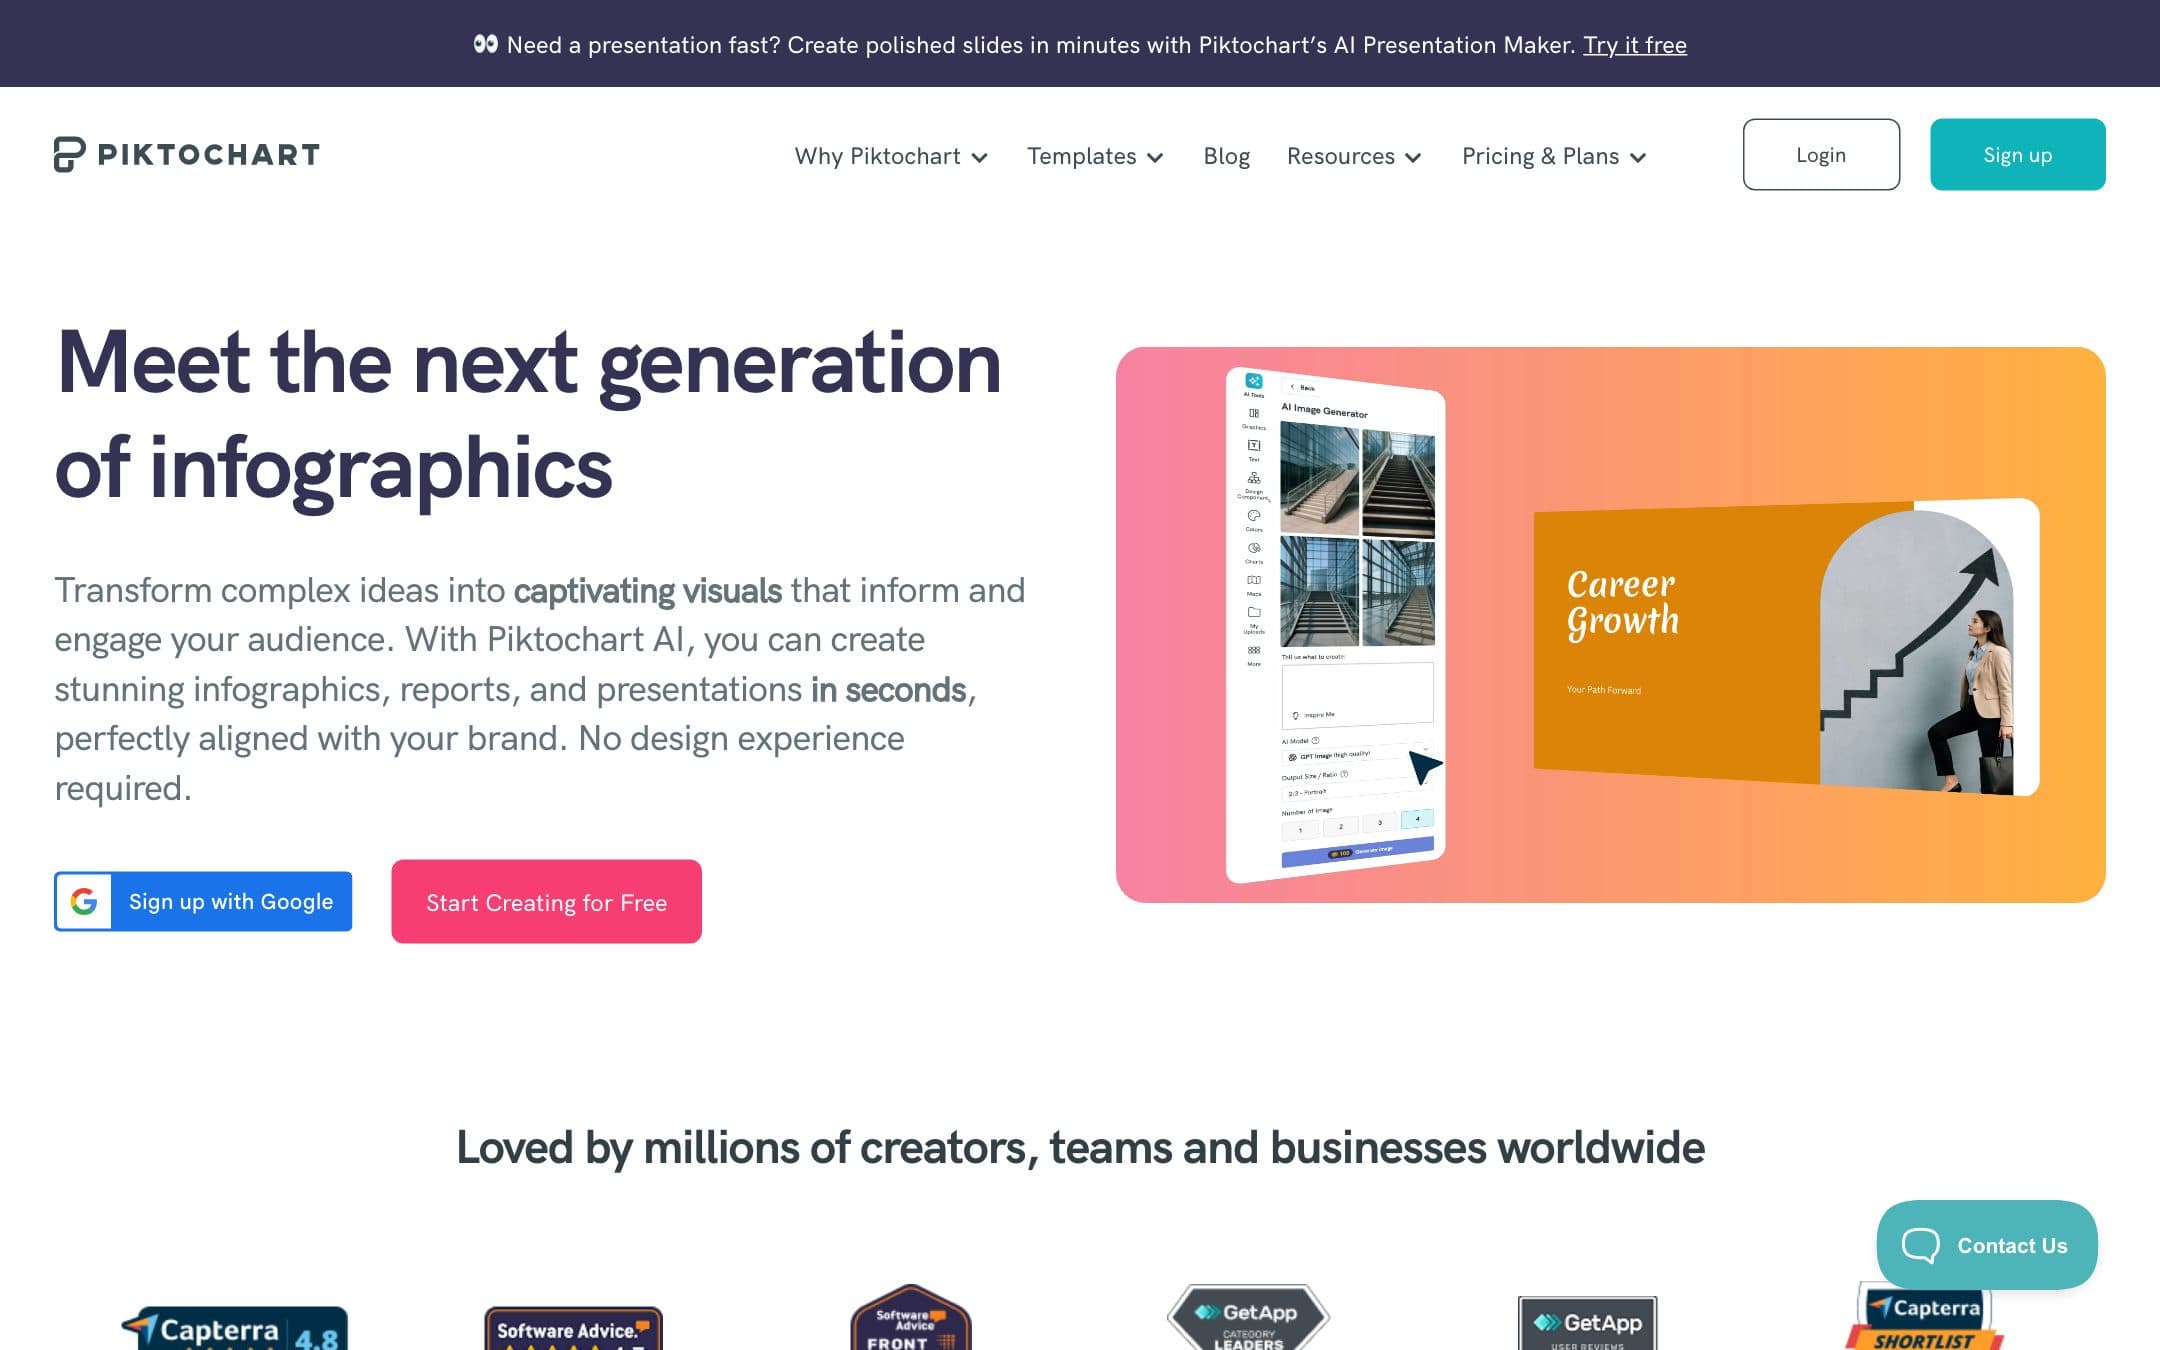
Infographics, reports and data-led one-pagers. That is what Piktochart is for, that is what it is good at, and outside it there is not much here.
For somebody who wants a narrower tool than Canva and less to learn, narrowness is a feature. The editor is clean, it does not overwhelm, and one infographic comes out the other end without a tutorial.
It scores 6.7 under how we rate. In our comparison it is an also-considered rather than a pick, on export formats rather than on the editor.
What you can actually export
Here is the thing to work out before you subscribe, because it decides which plan you need and the answer is not the obvious one.
PNG on every plan. PDF and PowerPoint only on Business, at $204 a year per user.
Pro is $120 a year per user, or $15 a month, and gives you unlimited PNG downloads and transparent backgrounds.
So a tool built around reports holds the report formats behind its top tier. If you are making an infographic to post, Pro is fine. If you are making anything that has to be printed, emailed as a document or dropped into a deck, the price is $204, which is eighty four dollars more and above Canva Pro.
No plan on Piktochart's comparison table lists SVG, at any tier.
A free plan that is really a trial
Two PNG downloads. Not two a month. Two.
Piktochart states it plainly: "Free users has a limit of 2 download credits and only in PNG file format". Free templates only, 1 GB of storage, 60 AI credits.
Most of the other free tiers here are plans you could sit on. Snappa gives three downloads a month indefinitely and Canva gives a large free library with a commercial licence attached to the free content in it. Two downloads in total is a trial with the word free on it, and calling it that would be more honest.
And whether those two downloads come out watermarked, Piktochart does not say. The free tier is gated by count and format, and no vendor page addresses marking. We looked. Four other vendors in this comparison leave the same question open.
Who owns what, and what you grant back
Piktochart's position on your work is good and its position on your content is worth reading twice.
The good part: "All users own the copyrights of all graphic materials created using Piktochart." No qualification by plan.
The ambiguity: the same article says Pro users may sell their visuals as a final product or service, and never says where that leaves a free user. Copyright ownership and the right to sell are not the same thing, and Piktochart draws a distinction it does not define. Pro at $120 is the cheapest plan with an unambiguous answer, which is why that is the figure our comparison uses.
The part to read twice: the terms take "world-wide, perpetual, non-exclusive, royalty-free, assignable, sublicensable, transferable rights to use and publicly display Your Content for any purpose". You own it, and you have handed the vendor a very broad standing right to it.
On AI, the terms address whether output is accurate and never address who owns it, which Canva, Visme and Desygner all state explicitly. Credits are published: 60 free, 500 on Pro, 1,000 on Business.
Who should buy it
Pro is the plan for infographics you post as images, when you want a tool that does less than Canva and asks less of you. On that brief it is good and the price is reasonable.
Buy Business only if you need PDF or PowerPoint, and price that against Canva Pro at $180 first, because Canva exports both and does a great deal more besides.
Do not treat the free plan as a plan. And if the free-tier licence question matters to you, read Piktochart's silence about free users as a no. It is the only safe way to read an undefined right in somebody else's terms.
Prices, export formats and the commercial-use position on this page were read from the vendor pricing page, support centre and terms of use on . We did not test the products in this comparison.